What is ReX-MLE?
ReX-MLE is a benchmark of 20 tasks drawn from high-impact medical imaging competitions spanning segmentation, detection, classification, image quality assessment, and generative enhancement. Each challenge pairs standardized data-preparation scripts and official evaluation code with end-to-end agent runs, enabling reproducible measurement of autonomous ML systems under realistic constraints.
Please refer to the Github repository for more details.
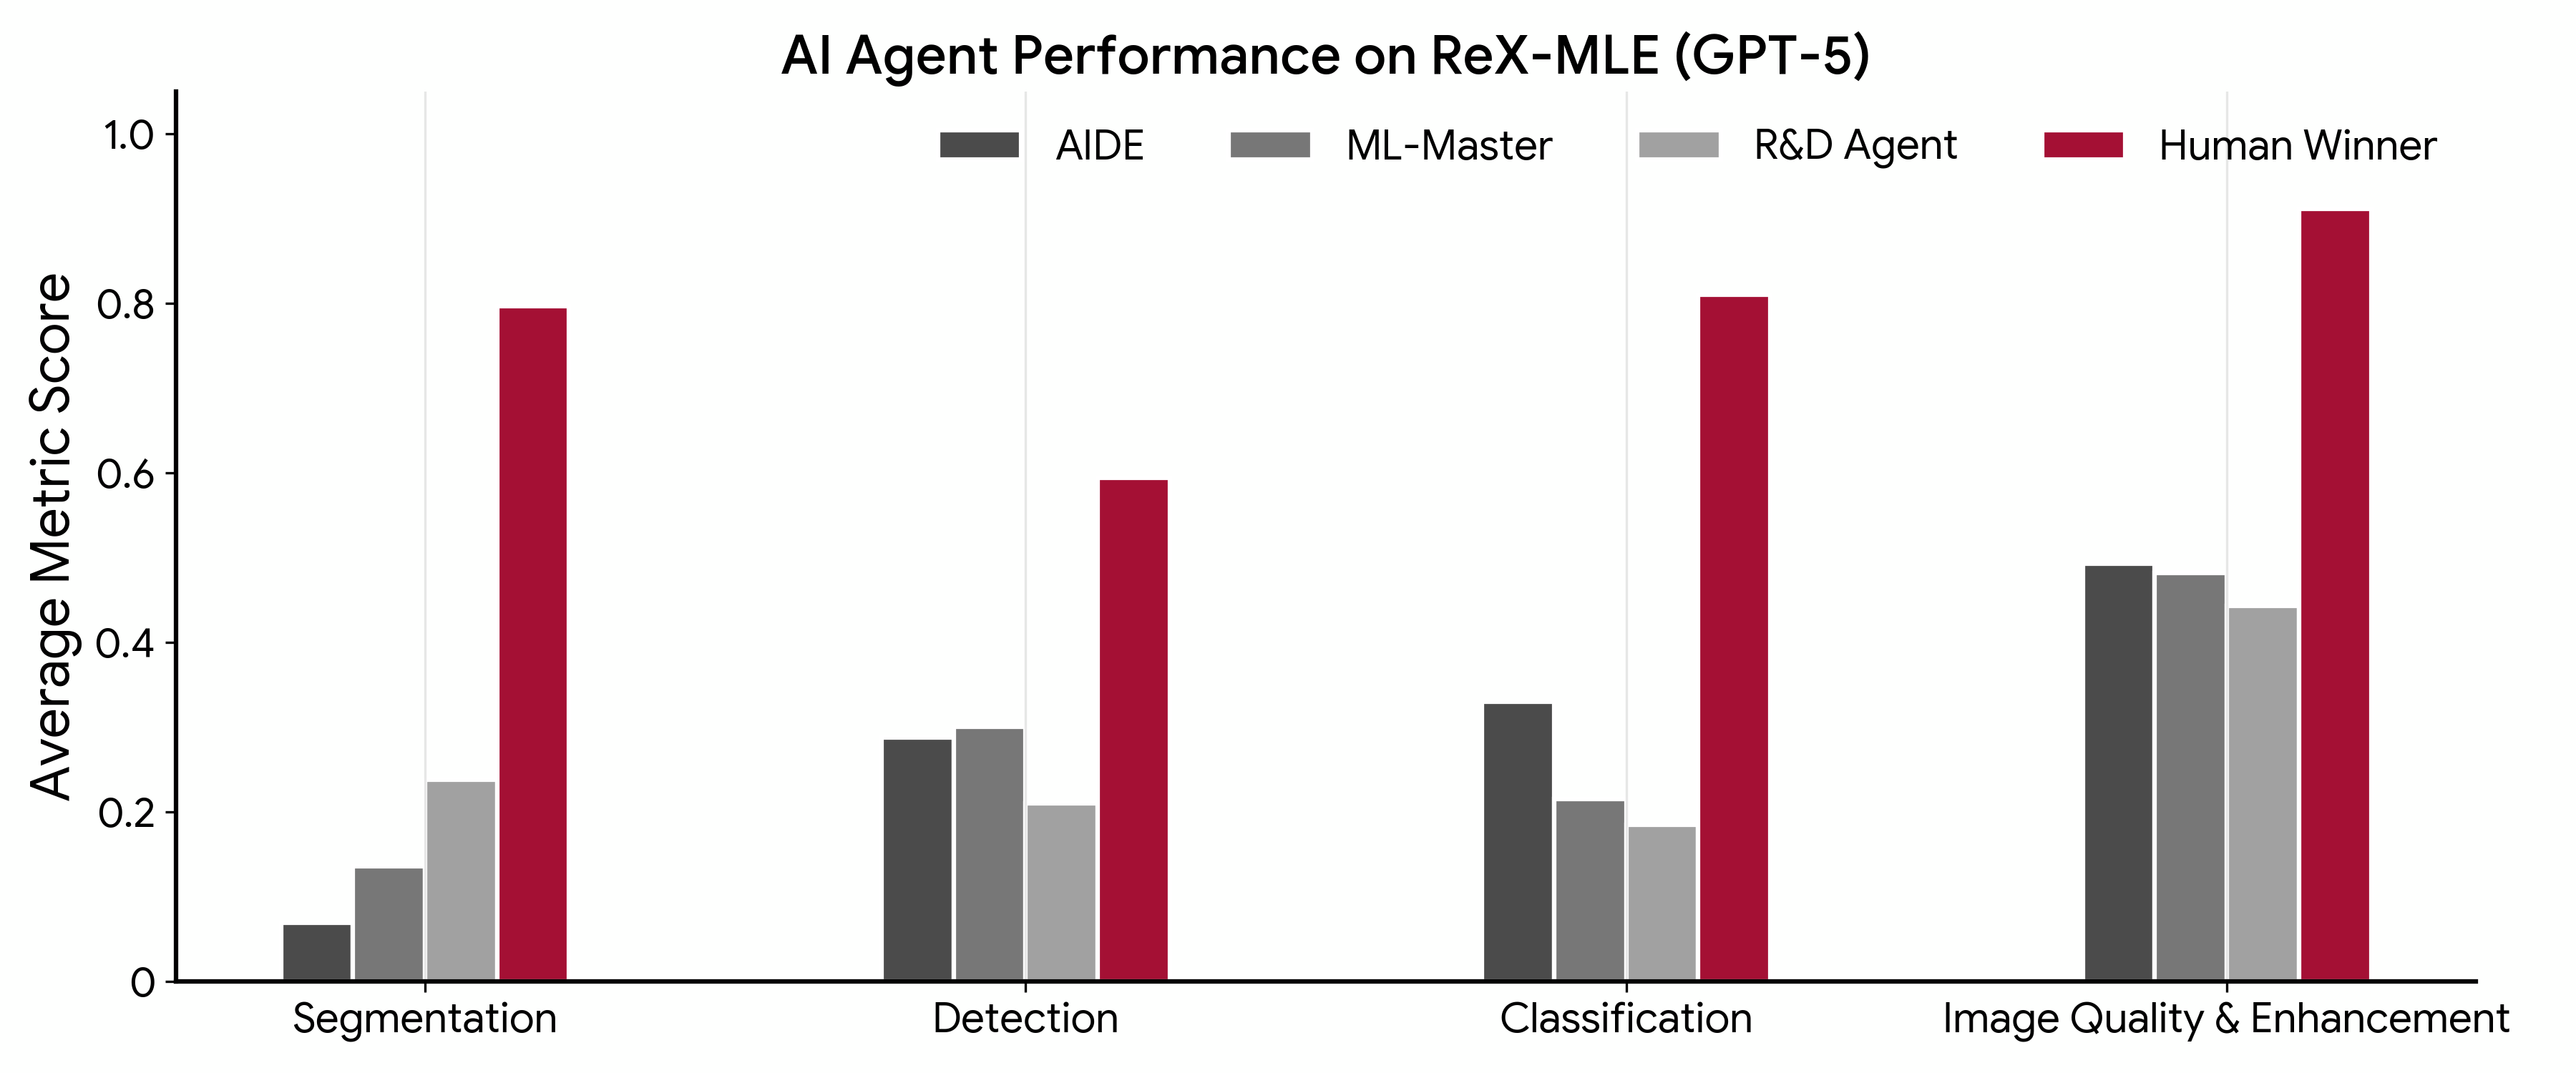
Performance Overview
Average performance across task categories (segmentation, detection, classification, and image quality/enhancement). Values correspond to the primary metric for each challenge (failures shown as zero).
Example Overview
Browse example AIDE agent runs from the ISLES'22 task.
Leaderboard
Agent performance across the ReX-MLE suite with primary metric values and percentile ranks (Competition Rank) separated.
| Challenge | Metric (↑) | AIDE | ML-Master | R&D-Agent | Human | |||
|---|---|---|---|---|---|---|---|---|
| Value | Rank | Value | Rank | Value | Rank | Value | ||
| Segmentation Tasks | ||||||||
| ISLES'22 | Dice | 0.04 | 0% | 0.00 | 0% | 0.02 | 0% | 0.79 |
| NeurIPS-CellSeg | F1 | 0.04 | 0% | 0.04 | 0% | 0.36 | 0% | 0.88 |
| PANTHER-T1 | Dice | 0.33 | 16% | 0.13 | 8% | 0.16 | 8% | 0.73 |
| PANTHER-T2 | Dice | 0.09 | 10% | 0.05 | 8% | 0.28 | 58% | 0.53 |
| PUMA-T1-Seg | Dice | FAIL | -- | 0.00 | 0% | 0.00 | 0% | 0.78 |
| PUMA-T2-Seg | Dice | 0.00 | 0% | 0.00 | 0% | 0.00 | 0% | 0.78 |
| SEG.A | Dice | 0.02 | 0% | 0.02 | 0% | 0.00 | 0% | 0.92 |
| TopBrain-CTA | Mean Dice | 0.03 | 2% | 0.26 | 3% | 0.08 | 2% | 0.79 |
| TopBrain-MRA | Mean Dice | 0.01 | 10% | 0.26 | 0% | 0.50 | 0% | 0.81 |
| TopCoW-CTA-Seg | Mean Dice | 0.09 | 0% | 0.25 | 3% | 0.49 | 2% | 0.87 |
| TopCoW-MRA-Seg | Mean Dice | 0.11 | 0% | 0.48 | 0% | 0.73 | 3% | 0.88 |
| Detection Tasks | ||||||||
| DENTEX | AP | 0.09 | 0% | 0.08 | 0% | 0.09 | 0% | 0.40 |
| PUMA-T1-Det | F1 | 0.02 | 0% | 0.08 | 0% | 0.06 | 0% | 0.66 |
| PUMA-T2-Det | F1 | FAIL | -- | 0.00 | 0% | 0.01 | 0% | 0.27 |
| TopCoW-CTA-Det | IoU | 0.67 | 38% | 0.65 | 25% | 0.70 | 56% | 0.79 |
| TopCoW-MRA-Det | IoU | 0.66 | 14% | 0.69 | 14% | 0.19 | 14% | 0.85 |
| Classification Tasks | ||||||||
| TopCoW-CTA-Cls | Accuracy | 0.33 | 33% | 0.10 | 0% | 0.28 | 50% | 0.73 |
| TopCoW-MRA-Cls | Accuracy | 0.33 | 25% | 0.33 | 25% | 0.09 | 0% | 0.89 |
| Image Quality & Enhancement Tasks | ||||||||
| LDCT-IQA | Score | 2.62 | 33% | 2.50 | 0% | 2.66 | 50% | 2.74 |
| USenhance | LNCC | 0.11 | 0% | 0.13 | 0% | FAIL | -- | 0.91 |
| Overall | ||||||||
| Overall Mean Percentile | -- | -- | 9.05% | -- | 4.53% | -- | 12.15% | -- |